class: center, middle, inverse, title-slide # Estadística Inferencial en R ## Día 1 del curso:<br/>Análisis de RNA-seq en R ### Andree Valle Campos<br/> <span class="citation">@avallecam</span> ### CDC - Perú<br/>Centro Nacional de Epidemiología,<br/>Prevención y Control de Enfermedades ### 2019-02-15 --- # Temario 1. __(breve) Introduction a R__ * Conceptos clave 2. __Variables:__ * Concepto y clasificación * Explorar distribuciones * __Prueba de Hipótesis:__ limitantes y alternativas 5. __Modelos lineales:__ * __Regresión lineal y logística__ * Relación con PH * __Comparación múltiple:__ corrección del valor p y FDR * Aplicación en _microarrays_ --- # Metodología - Teórico y __práctico__ -- * Definiciones y procedimientos * Responder a: _¿y cómo lo hago en R?_ -- - Material * 2 archivos de teoría en PDF * 5 practicas + solucionario -- - Contenido disponible en __https://avallecam.github.io/biostat2019/__ --- class: center, middle # ¡Pregunta 1! ## Del 1 al 5, ¿Qué tan familiarizado estás con cada tema? --- class: inverse, center, middle # (breve) introducción a R --- class: center, middle __Ir a__ __`parte 02`__ [click aquí](https://speakerdeck.com/avallecam/01-biostat2019-slides) (luego retornar) --- # Práctica 1 ```r #aritmética 2+2 x <- 2 x+2 #funciones seq(1,10) rep(1,5) #vectores heights <- c(147.2, 153.5, 152.5, 162.0, 153.9) mean(heights) #subconjuntos y <- LETTERS[1:10] y[3:7] ``` Si necesitas ayuda: 1. Pregúntale a R con la función `help()` o `?`, p.e.: `help(mean)` o `?mean` 2. Nos pasas la voz :) --- class: inverse, center, middle # Variables <!-- - Enfatizar en los supuestos - Probabilidades, distribución normal, definición del estadístico z, valor p, - ¿teorema del límite central? -> error estandar -> intervalo de confianza - distribución T student --> --- # Variables: Ejemplo **VEF = Volumen Expiratorio Forzado (mL/s)** **¿Existe una asociación entre VEF y edad, talla, etc?** **¿Cómo se ve afectado el VEF en las personas que fuman?** - base: `espirometria.dta` - exposición: `edad`, `talla` - desenlace: `vef` <table> <thead> <tr> <th style="text-align:right;"> caso </th> <th style="text-align:right;"> codigo </th> <th style="text-align:right;"> edad </th> <th style="text-align:right;"> vef </th> <th style="text-align:right;"> talla </th> <th style="text-align:left;"> sexo </th> <th style="text-align:left;"> fumar </th> </tr> </thead> <tbody> <tr> <td style="text-align:right;"> 1 </td> <td style="text-align:right;"> 301 </td> <td style="text-align:right;"> 9 </td> <td style="text-align:right;"> 1.708 </td> <td style="text-align:right;"> 57.0 </td> <td style="text-align:left;"> female </td> <td style="text-align:left;"> No </td> </tr> <tr> <td style="text-align:right;"> 2 </td> <td style="text-align:right;"> 451 </td> <td style="text-align:right;"> 8 </td> <td style="text-align:right;"> 1.724 </td> <td style="text-align:right;"> 67.5 </td> <td style="text-align:left;"> female </td> <td style="text-align:left;"> No </td> </tr> <tr> <td style="text-align:right;"> 3 </td> <td style="text-align:right;"> 501 </td> <td style="text-align:right;"> 7 </td> <td style="text-align:right;"> 1.720 </td> <td style="text-align:right;"> 54.5 </td> <td style="text-align:left;"> female </td> <td style="text-align:left;"> No </td> </tr> <tr> <td style="text-align:right;"> 4 </td> <td style="text-align:right;"> 642 </td> <td style="text-align:right;"> 9 </td> <td style="text-align:right;"> 1.558 </td> <td style="text-align:right;"> 53.0 </td> <td style="text-align:left;"> male </td> <td style="text-align:left;"> No </td> </tr> <tr> <td style="text-align:right;"> 5 </td> <td style="text-align:right;"> 901 </td> <td style="text-align:right;"> 9 </td> <td style="text-align:right;"> 1.895 </td> <td style="text-align:right;"> 57.0 </td> <td style="text-align:left;"> male </td> <td style="text-align:left;"> No </td> </tr> <tr> <td style="text-align:right;"> 6 </td> <td style="text-align:right;"> 1701 </td> <td style="text-align:right;"> 8 </td> <td style="text-align:right;"> 2.336 </td> <td style="text-align:right;"> 61.0 </td> <td style="text-align:left;"> female </td> <td style="text-align:left;"> No </td> </tr> </tbody> </table> --- # Variables numéricas ```r espir %>% select(edad,vef,talla) %>% * skim() ``` <table class="table" style="font-size: 15px; width: auto !important; margin-left: auto; margin-right: auto;"> <thead> <tr> <th style="text-align:left;"> skim_variable </th> <th style="text-align:right;"> n_missing </th> <th style="text-align:right;"> mean </th> <th style="text-align:right;"> sd </th> <th style="text-align:right;"> p0 </th> <th style="text-align:right;"> p25 </th> <th style="text-align:right;"> p50 </th> <th style="text-align:right;"> p75 </th> <th style="text-align:right;"> p100 </th> <th style="text-align:left;"> hist </th> </tr> </thead> <tbody> <tr> <td style="text-align:left;"> edad </td> <td style="text-align:right;"> 0 </td> <td style="text-align:right;"> 9.931193 </td> <td style="text-align:right;"> 2.9539352 </td> <td style="text-align:right;"> 3.000 </td> <td style="text-align:right;"> 8.000 </td> <td style="text-align:right;"> 10.0000 </td> <td style="text-align:right;"> 12.0000 </td> <td style="text-align:right;"> 19.000 </td> <td style="text-align:left;"> ▂▇▇▃▁ </td> </tr> <tr> <td style="text-align:left;"> vef </td> <td style="text-align:right;"> 0 </td> <td style="text-align:right;"> 2.636780 </td> <td style="text-align:right;"> 0.8670591 </td> <td style="text-align:right;"> 0.791 </td> <td style="text-align:right;"> 1.981 </td> <td style="text-align:right;"> 2.5475 </td> <td style="text-align:right;"> 3.1185 </td> <td style="text-align:right;"> 5.793 </td> <td style="text-align:left;"> ▃▇▆▂▁ </td> </tr> <tr> <td style="text-align:left;"> talla </td> <td style="text-align:right;"> 0 </td> <td style="text-align:right;"> 61.143578 </td> <td style="text-align:right;"> 5.7035128 </td> <td style="text-align:right;"> 46.000 </td> <td style="text-align:right;"> 57.000 </td> <td style="text-align:right;"> 61.5000 </td> <td style="text-align:right;"> 65.5000 </td> <td style="text-align:right;"> 74.000 </td> <td style="text-align:left;"> ▂▅▇▇▂ </td> </tr> </tbody> </table> --- # Variables numéricas: PH .pull-left[ ```r espir %>% * ggplot(aes(x=talla,y=vef)) + geom_point() + geom_smooth(method = "lm") ``` <!-- --> ] -- .pull-right[ ```r espir %>% select(edad,vef,talla) %>% * correlate() %>% rearrange() %>% shave() ``` ``` ## # A tibble: 3 x 4 ## term edad talla vef ## <chr> <dbl> <dbl> <dbl> ## 1 edad NA NA NA ## 2 talla 0.792 NA NA ## 3 vef 0.756 0.868 NA ``` ] --- # Variables categóricas ```r espir %>% * tabyl(sexo) %>% adorn_totals("row") %>% adorn_pct_formatting() ``` ``` ## sexo n percent ## male 336 51.4% ## female 318 48.6% ## Total 654 100.0% ``` -- ```r espir %>% * tabyl(sexo,fumar) %>% adorn_totals(c("col")) %>% adorn_percentages() %>% adorn_pct_formatting() %>% adorn_ns(position = "front") %>% adorn_title() ``` ``` ## fumar ## sexo No Si Total ## male 310 (92.3%) 26 (7.7%) 336 (100.0%) ## female 279 (87.7%) 39 (12.3%) 318 (100.0%) ``` --- # Variables categóricas: PH ```r espir %>% tabyl(sexo,fumar) %>% * chisq.test() %>% tidy() ``` ``` ## # A tibble: 1 x 4 ## statistic p.value parameter method ## <dbl> <dbl> <int> <chr> ## 1 3.25 0.0714 1 Pearson's Chi-squared test with Yates' continuity~ ``` --- # Variables numéricas y categóricas .pull-left[ ```r espir %>% ggplot(aes(x=fumar,y=vef)) + geom_point( * aes(color=fumar), * position = "jitter") + * geom_boxplot(alpha=0) ``` <!-- --> ] -- .pull-right[ ```r espir %>% ggplot(aes(x=fumar,y=vef)) + * geom_violin(aes(color=fumar)) ``` <!-- --> ] --- # Variables numéricas y categóricas: PH ```r espir %>% select(fumar,vef) %>% * group_by(fumar) %>% skim() ``` <table class="table" style="font-size: 15px; width: auto !important; margin-left: auto; margin-right: auto;"> <thead> <tr> <th style="text-align:left;"> skim_variable </th> <th style="text-align:left;"> fumar </th> <th style="text-align:right;"> n_missing </th> <th style="text-align:right;"> mean </th> <th style="text-align:right;"> sd </th> <th style="text-align:right;"> p0 </th> <th style="text-align:right;"> p25 </th> <th style="text-align:right;"> p50 </th> <th style="text-align:right;"> p75 </th> <th style="text-align:right;"> p100 </th> <th style="text-align:left;"> hist </th> </tr> </thead> <tbody> <tr> <td style="text-align:left;"> vef </td> <td style="text-align:left;"> No </td> <td style="text-align:right;"> 0 </td> <td style="text-align:right;"> 2.566143 </td> <td style="text-align:right;"> 0.8505215 </td> <td style="text-align:right;"> 0.791 </td> <td style="text-align:right;"> 1.920 </td> <td style="text-align:right;"> 2.465 </td> <td style="text-align:right;"> 3.048 </td> <td style="text-align:right;"> 5.793 </td> <td style="text-align:left;"> ▃▇▅▂▁ </td> </tr> <tr> <td style="text-align:left;"> vef </td> <td style="text-align:left;"> Si </td> <td style="text-align:right;"> 0 </td> <td style="text-align:right;"> 3.276861 </td> <td style="text-align:right;"> 0.7499863 </td> <td style="text-align:right;"> 1.694 </td> <td style="text-align:right;"> 2.795 </td> <td style="text-align:right;"> 3.169 </td> <td style="text-align:right;"> 3.751 </td> <td style="text-align:right;"> 4.872 </td> <td style="text-align:left;"> ▂▃▇▃▂ </td> </tr> </tbody> </table> -- ```r t.test(vef ~ fumar, data = espir, var.equal=FALSE) %>% * tidy() ``` <table class="table" style="font-size: 15px; width: auto !important; margin-left: auto; margin-right: auto;"> <thead> <tr> <th style="text-align:right;"> estimate </th> <th style="text-align:right;"> estimate1 </th> <th style="text-align:right;"> estimate2 </th> <th style="text-align:right;"> statistic </th> <th style="text-align:right;"> p.value </th> <th style="text-align:right;"> parameter </th> <th style="text-align:right;"> conf.low </th> <th style="text-align:right;"> conf.high </th> <th style="text-align:left;"> method </th> <th style="text-align:left;"> alternative </th> </tr> </thead> <tbody> <tr> <td style="text-align:right;"> -0.71 </td> <td style="text-align:right;"> 2.57 </td> <td style="text-align:right;"> 3.28 </td> <td style="text-align:right;"> -7.15 </td> <td style="text-align:right;"> 0 </td> <td style="text-align:right;"> 83.27 </td> <td style="text-align:right;"> -0.91 </td> <td style="text-align:right;"> -0.51 </td> <td style="text-align:left;"> Welch Two Sample t-test </td> <td style="text-align:left;"> two.sided </td> </tr> </tbody> </table> --- # Práctica 2 ```r #importar base en formato DTA espir <- read_dta("data-raw/espirometria.dta") %>% as_factor() #generar resumen descriptivo espir %>% skim() #grafica distribución espir %>% ggplot(aes(vef)) + geom_histogram() #realizar pruebas de hipótesis #experimenta y describe qué cambios genera cada uno de los argumentos? compareGroups(formula = fumar ~ edad + vef + talla + sexo, data = espir, byrow=T, method=c(vef=2) ) %>% createTable(show.all = T) %>% export2xls("table/tab1.xls") ``` --- # Comentario: Pruebas de hipótesis - __Limitante:__ - dicotomización de resultados en significativos y no significativos - valor p da indicativo de _tamaño de efecto_, pero no lo cuantifica - __Alternativa<sup>1</sup>:__ <img src="notrack/estimation_plot.PNG" width="100%" /> .footnote[ [1] [Moving beyond P values: data analysis with estimation graphics](https://www.nature.com/articles/s41592-019-0470-3.epdf?author_access_token=Euy6APITxsYA3huBKOFBvNRgN0jAjWel9jnR3ZoTv0Pr6zJiJ3AA5aH4989gOJS_dajtNr1Wt17D0fh-t4GFcvqwMYN03qb8C33na_UrCUcGrt-Z0J9aPL6TPSbOxIC-pbHWKUDo2XsUOr3hQmlRew%3D%3D) ] --- class: inverse, center, middle # Modelos lineales --- # ¿**Por qué** usar una **regresión**? -- <img src="notrack/nmeth.3627-F1.jpg" width="90%" style="display: block; margin: auto;" /> -- - Porque: - Fija una **variable independiente** o **exposición** y observa una respuesta en la **variable dependiente** o **desenlace**. - Permite **explicar** el cambio promedio de un evento `\(Y\)` en base a cambios en `\(X\)`, usando coeficientes o medidas de asociación. - Permite **predecir** la probabilidad asociada a un evento. - Permite **cuantificar** el tamaño del efecto de la comparación. --- # Regresión Lineal Simple .pull-left[ ## características - **una** variable independiente (simple) - **una** variable dependiente (univariada) - ambas variables deben ser **numéricas** ## objetivos - ajustar datos a una recta - interpretar medida de bondad de ajuste ( `\(R^2\)` ) y coeficientes - evaluar supuestos - visualizar el modelo ] .pull-right[ <!-- --> `$$Y = \beta_0 + \beta_1 X_1 + \epsilon$$` ] --- # RLinS: Ejemplo .pull-left[ ```r espir %>% * ggplot(aes(x=edad,y=vef)) + geom_point() ``` 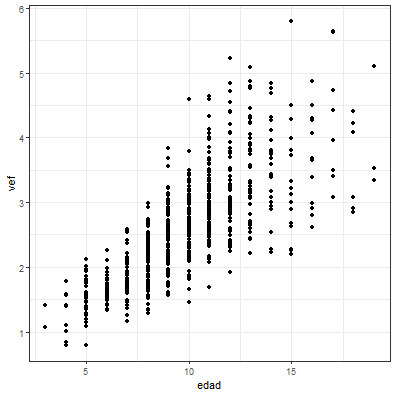<!-- --> ] -- .pull-right[ - __Pregunta__ + **¿Existe una relación lineal entre edad y VEF?** + **¿En cuánto incrementa el VEF, por cada incremento en un año de edad?** ] --- # RLinS: Ejemplo .pull-left[ ```r espir %>% ggplot(aes(x=edad,y=vef)) + geom_point() ``` <!-- --> ] .pull-right[ - __Pregunta__ + **¿Existe una relación lineal entre edad y VEF?** + **¿En cuánto incrementa el VEF, por cada incremento en un año de edad?** - __Evaluación de supuestos:__ + **#1** independencia de observaciones + **#2** linealidad ] --- # RLinS: residuales - Definición: Diferencia entre el _valor observado_ y el _valor predicho_ en el eje vertical. .pull-left[ <img src="notrack/Inkedlss01_LI.jpg" width="60%" style="display: block; margin: auto;" /> <img src="notrack/Inkedlss02_LI.jpg" width="60%" style="display: block; margin: auto;" /> ] -- .pull-right[ <img src="notrack/Inkedlss02_LI.jpg" width="60%" style="display: block; margin: auto;" /> <img src="notrack/Inkedlss03_LI.jpg" width="60%" style="display: block; margin: auto;" /> ] --- # RLinS: suma de mínimos cuadrados .pull-left[ <!--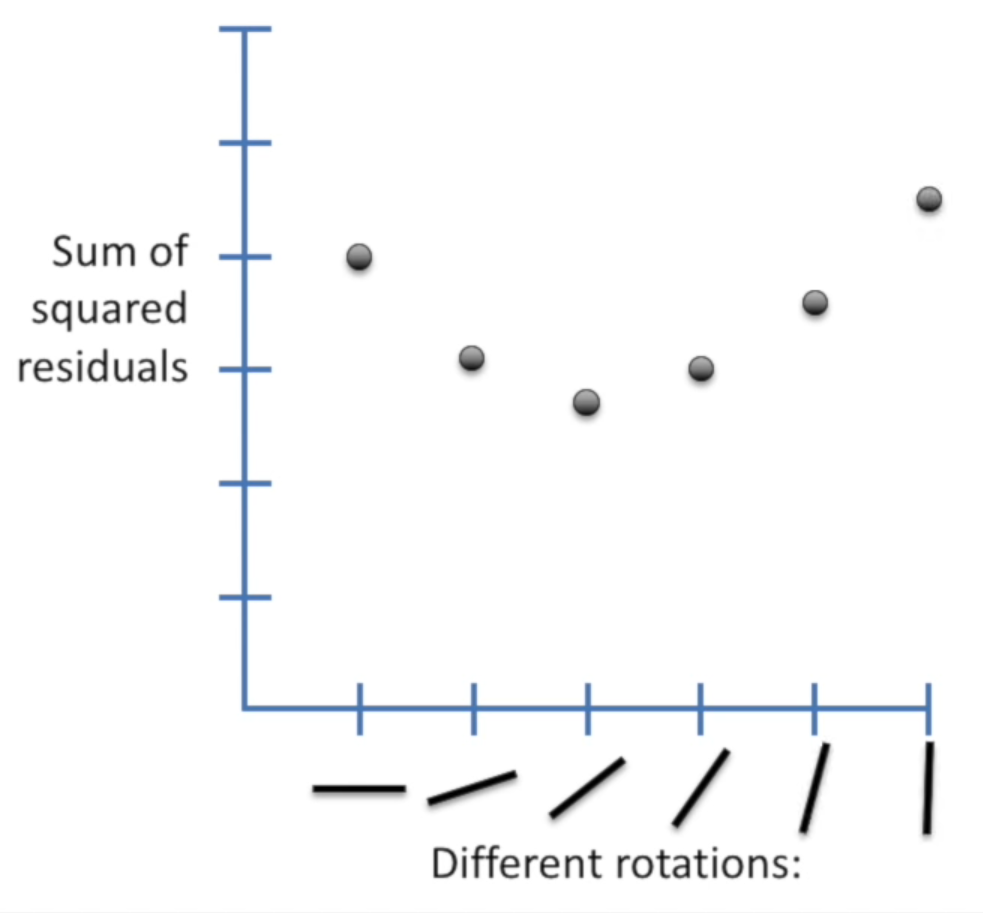--> <img src="notrack/lss.png" width="90%" /> ] -- .pull-right[ Cálculo de la **sumatoria del cuadrado de los residuales** hacia la media y la recta: $$ SSE(mean) = \sum (data - mean)^2 $$ $$ SSE(fit) = \sum (data - fit)^2 $$ ] --- # RLinS: suma de mínimos cuadrados .pull-left[ <!----> <img src="notrack/lss.png" width="90%" /> ] .pull-right[ Cálculo de la **sumatoria del cuadrado de los residuales** hacia la media y la recta: $$ SSE(mean) = \sum (data - mean)^2 $$ $$ SSE(fit) = \sum (data - fit)^2 $$ $$ Var(x) = \frac{SSE(x)^2}{n} $$ Medida de **bondad de ajuste**: $$ R^2 = \frac{Var(mean) - Var(fit)}{Var(mean)} $$ ] --- # RLinS: bondad de ajuste ```r wm1 <- lm(vef ~ edad, data = espir) wm1 %>% * glance() ``` ``` ## # A tibble: 1 x 6 ## r.squared adj.r.squared sigma statistic p.value df ## <dbl> <dbl> <dbl> <dbl> <dbl> <dbl> ## 1 0.572 0.572 0.568 872. 2.45e-122 1 ``` **INTERPRETACIÓN** -- - **edad** _explica_ el **57%** de la variabilidad de **VEF** - existe un **57%** _de reducción en_ la variabilidad de **VEF** al tomar en cuenta la **edad** --- # RLinS: coeficientes ```r wm1 %>% tidy() ``` ``` ## # A tibble: 2 x 5 ## term estimate std.error statistic p.value ## <chr> <dbl> <dbl> <dbl> <dbl> ## 1 (Intercept) 0.432 0.0779 5.54 4.36e- 8 ## 2 edad 0.222 0.00752 29.5 2.45e-122 ``` **INTERPRETACIÓN** -- <img src="notrack/logan-06.PNG" width="90%" /> --- # RLinS: coeficientes ```r wm1 %>% tidy() ``` ``` ## # A tibble: 2 x 5 ## term estimate std.error statistic p.value ## <chr> <dbl> <dbl> <dbl> <dbl> ## 1 (Intercept) 0.432 0.0779 5.54 4.36e- 8 ## 2 edad 0.222 0.00752 29.5 2.45e-122 ``` ```r *wm1 %>% tidy(conf.int=TRUE) ``` ``` ## # A tibble: 2 x 7 ## term estimate std.error statistic p.value conf.low conf.high ## <chr> <dbl> <dbl> <dbl> <dbl> <dbl> <dbl> ## 1 (Intercept) 0.432 0.0779 5.54 4.36e- 8 0.279 0.585 ## 2 edad 0.222 0.00752 29.5 2.45e-122 0.207 0.237 ``` - `\(\beta_{edad}\)`: - En la población, por cada incremento de **edad** en _una unidad_, el **VEF** en promedio _incrementa_ en 0.22 mL/s, - con un intervalo de confianza al 95% de 0.21 a 0.24 mL/s. - Este resultado es estadísticamente significativo con un valor **p < 0.001** --- # RLinS: supuesto **#3** normalidad residuales .pull-left[ <img src="notrack/Inkedlss03_LI.jpg" width="75%" /> ] .pull-right[ <img src="notrack/nmeth.3854-F2.jpg" width="100%" /> ] --- # RLinS: supuesto **#3** normalidad residuales - generación de _dataframe_ con: * `.fitted` : valor predicho de Y para valor de X ( `\(\hat Y\)` ) * `.resid` : valor crudo del residual ( `\(Y - \hat Y\)` ) * `.std.resid` : valor _estudiantizado_ del residual ```r wm1 %>% * augment() ``` ``` ## # A tibble: 654 x 8 ## vef edad .fitted .resid .hat .sigma .cooksd .std.resid ## <dbl> <dbl> <dbl> <dbl> <dbl> <dbl> <dbl> <dbl> ## 1 1.71 9 2.43 -0.722 0.00168 0.567 0.00137 -1.27 ## 2 1.72 8 2.21 -0.484 0.00218 0.568 0.000797 -0.854 ## 3 1.72 7 1.99 -0.266 0.00304 0.568 0.000335 -0.469 ## 4 1.56 9 2.43 -0.872 0.00168 0.567 0.00199 -1.54 ## 5 1.89 9 2.43 -0.535 0.00168 0.568 0.000750 -0.944 ## 6 2.34 8 2.21 0.128 0.00218 0.568 0.0000558 0.226 ## 7 1.92 6 1.76 0.155 0.00424 0.568 0.000160 0.274 ## 8 1.41 6 1.76 -0.349 0.00424 0.568 0.000808 -0.616 ## 9 1.99 8 2.21 -0.221 0.00218 0.568 0.000166 -0.390 ## 10 1.94 9 2.43 -0.488 0.00168 0.568 0.000624 -0.861 ## # ... with 644 more rows ``` --- # RLinS: supuesto **#3** normalidad residuales .pull-left[ ```r wm1 %>% augment() %>% * ggplot(aes(.std.resid)) + geom_histogram() ``` 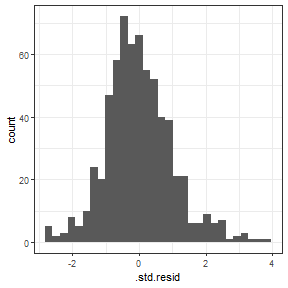<!-- --> ] -- .pull-right[ - **META:** puntos sobre la línea ```r wm1 %>% augment() %>% ggplot( * aes(sample=.std.resid) ) + * geom_qq() + * geom_qq_line() ``` 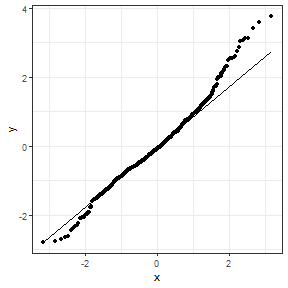<!-- --> ] --- # RLinS: supuesto **#4** homoscedasticidad <img src="notrack/logan-07.PNG" width="70%" style="display: block; margin: auto;" /> --- # RLinS: supuesto **#4** homoscedasticidad <img src="notrack/nmeth.3854-F1.jpg" width="80%" style="display: block; margin: auto;" /> --- # RLinS: supuesto **#4** homoscedasticidad - **META:** distribución idéntica a ambos lados de la línea ```r wm1 %>% augment() %>% ggplot(aes(.fitted,.std.resid)) + geom_point() + * geom_smooth() + geom_hline(yintercept = c(0)) ``` <img src="00-biostat2019-slides_files/figure-html/unnamed-chunk-42-1.png" style="display: block; margin: auto;" /> --- # RLinS: ¿cómo se ve el modelo? $$ Y = \beta_0 + \beta_1 X_1 + \epsilon $$ $$ VEF = 0.60 + 0.22 (edad) + \epsilon $$ ```r espir %>% ggplot(aes(edad,vef)) + geom_point() + * geom_smooth(method = "lm") ``` <img src="00-biostat2019-slides_files/figure-html/unnamed-chunk-43-1.png" style="display: block; margin: auto;" /> <!-- - ¿qué pasa si borramos `method = "lm"`? --> --- # RLinS: retroalimentación - `\(R^2\)` indica el porcentaje de _variabilidad_ del desenlace (var. dependiente) explicada por la exposición (var. independiente). - los **coeficientes** permiten __cuantificar__ el _tamaño del efecto_ de la exposición en el desenlace en base a un modelo estadístico. - los **supuestos** permiten evaluar qué tan adecuado es el ajuste de los datos al modelo. --- # Práctica 3 - **¿Existe una relación lineal entre talla y VEF?** ```r espir %>% ggplot(aes(x = talla,y = vef)) + geom____() ``` - identificar coeficientes y `\(R^2\)` ```r # recordar: y ~ x wm1 <- lm(_____ ~ _____, data = _____) wm1 %>% g_____ wm1 %>% t_____ wm1 %>% c_____ ``` - evaluar supuestos: normalidad y homoscedasticidad ```r wm1 %>% augment() %>% ggplot() + _____ wm1 %>% augment() %>% ggplot(aes(.fitted,.std.resid)) + __________ ``` --- # Regresión Logística Simple .pull-left[ ## características - **una** variable independiente (simple) - **una** variable dependiente (univariada) - la variable _dependiente_ debe ser **categórica dicotómica** ## objetivos - ajustar datos a una recta - interpretar coeficientes ] .pull-right[ <img src="notrack/nmeth.3904-F23.jpg" width="100%" /> `$$Y = \beta_0 + \beta_1 X_1 + \epsilon$$` ] --- # RlogS: Ecuación y coeficiente - `\(p\)` posee distribución _binomial_, linealizada `\([-\infty,\infty]\)` por la función _logit_ `$$logit(p) = log(odds) = log\left(\frac{p}{1-p}\right) \\ logit(p) = \beta_0 + \beta_1 X_1 + . . . + \beta_n X_n + \epsilon \enspace ; \enspace y \sim Binomial$$` -- <img src="00-biostat2019-slides_files/figure-html/unnamed-chunk-48-1.png" style="display: block; margin: auto;" /> --- # RlogS: Ecuación y coeficiente - `\(p\)` posee distribución _binomial_, linealizada `\([-\infty,\infty]\)` por la función _logit_ `$$logit(p) = log(odds) = log\left(\frac{p}{1-p}\right) \\ logit(p) = \beta_0 + \beta_1 X_1 + . . . + \beta_n X_n + \epsilon \enspace ; \enspace y \sim Binomial$$` - El valor exponenciado de los coeficientes se pueden interpretar como **Odds Ratio (OR)** `$$Y = \beta_0 + \beta_1 X_1 \\ \begin{cases} Y_{x=1} = log(odds_{x=1}) = \beta_0 + \beta_1(1) \\ Y_{x=0} = log(odds_{x=0}) = \beta_0 + \beta_1(0) \end{cases} \\ Y_{x=1} - Y_{x=0} = \beta_1 \\ log(odds_{x=1}) - log(odds_{x=0}) = \beta_1 \\ log \left(\frac{odds_{x=1}}{odds_{x=0}}\right) = \beta_1 \\ OR = exp(\beta_1)$$` --- # RlogS: Modelos Lineales Generalizados GLM ajusta modelos lineales de `\(g(y)\)` con covaribles `\(x\)` `$$g(Y) = \beta_0 + \sum_{n=1}^{n} \beta_n X_n \enspace , \enspace y \sim F$$` Donde: - `\(F\)` es la familia de distribución - `\(g(\space)\)` es la función de enlace -- <img src="notrack/logan-05.PNG" width="100%" /> --- # GLM: máxima verosimilitud .pull-left[ <img src="notrack/nmeth.3904-F3_A.jpg" width="100%" style="display: block; margin: auto;" /> ] .pull-right[ - La estimación de parámetros se da por un proceso de optimización llamado **máxima verosimilitud** (o _likelihood_). - un estimado por _máxima verosimilitud_ es aquel que maximiza la verosimilitud de obtener las actuales observaciones dado el modelo elegido. - estimación numérica mediante _proceso iterativo_ hasta la convergencia. ] --- # RlogS: Ejemplo **En personas VIH+, ¿el polimorfismo CCR5 está *asociado* con el desarrollo del SIDA?** - base: `aidsdb.dta` - exposición: `ccr5` - desenlace: `aids` <table> <thead> <tr> <th style="text-align:right;"> studyid </th> <th style="text-align:right;"> ttoaidsorexit </th> <th style="text-align:left;"> aids </th> <th style="text-align:right;"> age </th> <th style="text-align:left;"> race </th> <th style="text-align:right;"> loghivrna </th> <th style="text-align:right;"> cd4 </th> <th style="text-align:left;"> ccr2 </th> <th style="text-align:left;"> ccr5 </th> <th style="text-align:left;"> sdf1 </th> </tr> </thead> <tbody> <tr> <td style="text-align:right;"> 101750 </td> <td style="text-align:right;"> 1019 </td> <td style="text-align:left;"> Yes </td> <td style="text-align:right;"> 22 </td> <td style="text-align:left;"> race1 </td> <td style="text-align:right;"> 11.786481 </td> <td style="text-align:right;"> 434 </td> <td style="text-align:left;"> No </td> <td style="text-align:left;"> Yes </td> <td style="text-align:left;"> No </td> </tr> <tr> <td style="text-align:right;"> 101780 </td> <td style="text-align:right;"> 2809 </td> <td style="text-align:left;"> No </td> <td style="text-align:right;"> 25 </td> <td style="text-align:left;"> race2 </td> <td style="text-align:right;"> 12.916421 </td> <td style="text-align:right;"> 391 </td> <td style="text-align:left;"> Yes </td> <td style="text-align:left;"> Yes </td> <td style="text-align:left;"> No </td> </tr> <tr> <td style="text-align:right;"> 103328 </td> <td style="text-align:right;"> 1717 </td> <td style="text-align:left;"> Yes </td> <td style="text-align:right;"> 32 </td> <td style="text-align:left;"> race1 </td> <td style="text-align:right;"> 13.169676 </td> <td style="text-align:right;"> 819 </td> <td style="text-align:left;"> No </td> <td style="text-align:left;"> No </td> <td style="text-align:left;"> No </td> </tr> <tr> <td style="text-align:right;"> 104463 </td> <td style="text-align:right;"> 2315 </td> <td style="text-align:left;"> Yes </td> <td style="text-align:right;"> 31 </td> <td style="text-align:left;"> race1 </td> <td style="text-align:right;"> 10.649203 </td> <td style="text-align:right;"> 763 </td> <td style="text-align:left;"> No </td> <td style="text-align:left;"> No </td> <td style="text-align:left;"> No </td> </tr> <tr> <td style="text-align:right;"> 104525 </td> <td style="text-align:right;"> 3764 </td> <td style="text-align:left;"> No </td> <td style="text-align:right;"> 39 </td> <td style="text-align:left;"> race1 </td> <td style="text-align:right;"> 10.834726 </td> <td style="text-align:right;"> 520 </td> <td style="text-align:left;"> No </td> <td style="text-align:left;"> Yes </td> <td style="text-align:left;"> Yes </td> </tr> <tr> <td style="text-align:right;"> 107858 </td> <td style="text-align:right;"> 2643 </td> <td style="text-align:left;"> Yes </td> <td style="text-align:right;"> 39 </td> <td style="text-align:left;"> race1 </td> <td style="text-align:right;"> 6.790097 </td> <td style="text-align:right;"> NA </td> <td style="text-align:left;"> No </td> <td style="text-align:left;"> No </td> <td style="text-align:left;"> No </td> </tr> </tbody> </table> --- # RlogS: Interpretar variables categóricas ```r wm1 <- glm(aids ~ ccr5, data = aidsdb, * family = binomial(link = "logit")) ``` ``` ## # A tibble: 2 x 7 ## term log.or se or conf.low conf.high p.value ## <chr> <dbl> <dbl> <dbl> <dbl> <dbl> <dbl> ## 1 (Intercept) -0.487 0.106 0.614 0.499 0.754 0 ## 2 ccr5Yes 0.151 0.245 1.16 0.715 1.87 0.539 ``` **INTERPRETACIÓN** - `\(\beta_0\)` - En la población, el **odds** de tener sida dado que **no poseen CCR5** es **0.61**, - con un intervalo de confianza al 95% de 0.5 a 0.75. --- # RlogS: Interpretar variables categóricas ```r wm1 <- glm(aids ~ ccr5, data = aidsdb, * family = binomial(link = "logit")) ``` ``` ## # A tibble: 2 x 7 ## term log.or se or conf.low conf.high p.value ## <chr> <dbl> <dbl> <dbl> <dbl> <dbl> <dbl> ## 1 (Intercept) -0.487 0.106 0.614 0.499 0.754 0 ## 2 ccr5Yes 0.151 0.245 1.16 0.715 1.87 0.539 ``` **INTERPRETACIÓN** - `\(\beta_{CCR2:Yes}\)` - En la población, el **odds** de tener sida dado que **sí poseen CCR5** es - **1.16** veces, - el **odds** de tener depresión dado que **no poseen CCR5**, - con un intervalo de confianza al 95% de 0.72 a 1.87. - Este resultado no es estadísticamente significativo con un valor **p = 0.539** --- # RlogS: Interpretar variables contínuas ```r wm1 <- glm(aids ~ loghivrna, data = aidsdb, family = binomial(link = "logit")) ``` ``` ## # A tibble: 2 x 7 ## term log.or se or conf.low conf.high p.value ## <chr> <dbl> <dbl> <dbl> <dbl> <dbl> <dbl> ## 1 (Intercept) -2.52 0.593 0.0808 0.0246 0.252 0.00002 ## 2 loghivrna 0.216 0.0575 1.24 1.11 1.39 0.00017 ``` **INTERPRETACIÓN** - `\(\beta_{loghivrna}\)` - En la población, por cada incremento en una unidad del **log de RNA viral**, - el **odds** de sida _cambia_ en **1.24**, con un intervalo de confianza al 95% de 1.11 a 1.39. - Este resultado es estadísticamente significativo con un valor **p < 0.001** --- # Práctica 4 - **¿Qué otros marcadores están asociados con el desarrollo de SIDA?** - **Intenta ajustar por otras covariables como edad, raza o sexo** ```r # recordar: y ~ x wm1 <- glm(_____ ~ _____, data=_____, family= _____(link="_____")) wm1 %>% g_____ wm1 %>% t_____ wm1 %>% c_____ wm1 %>% a_____ wm1 %>% epitidy::epi_tidymodel_or() ``` --- # Relación con Prueba de Hipótesis <img src="notrack/linear_tests_cheat_sheet.png" width="100%" style="display: block; margin: auto;" /> .footnote[ [1] [Jonas Kristoffer Lindeløv](https://lindeloev.github.io/tests-as-linear/) ] --- class: inverse, center, middle # Comparaciones múltiples --- # Problema: _multiple hypothesis testing_ - Cuando monitoreamos un gran número de resultados experimentales, esperamos observar descubrimientos que ocurren al azar. - Los métodos desarrollados para ajustar o reinterpretar los valores p son llamados _métodos de corrección por múltiples comparaciones_. - p.e.: experimentos ómicos: <img src="notrack/nmeth.2900-F1.jpg" width="75%" style="display: block; margin: auto;" /> --- background-image: url(notrack/statquest-3.png) background-size: contain .footnote[ Stamer J. [StatQuest](https://www.youtube.com/user/joshstarmer/playlists) ] --- background-image: url(notrack/statquest-6.png) background-size: contain .footnote[ Stamer J. [StatQuest](https://www.youtube.com/user/joshstarmer/playlists) ] --- background-image: url(notrack/statquest-7.png) background-size: contain .footnote[ Stamer J. [StatQuest](https://www.youtube.com/user/joshstarmer/playlists) ] --- background-image: url(notrack/statquest-10.png) background-size: contain .footnote[ Stamer J. [StatQuest](https://www.youtube.com/user/joshstarmer/playlists) ] --- background-image: url(notrack/statquest-12.png) background-size: contain .footnote[ Stamer J. [StatQuest](https://www.youtube.com/user/joshstarmer/playlists) ] --- background-image: url(notrack/statquest-13.png) background-size: contain .footnote[ Stamer J. [StatQuest](https://www.youtube.com/user/joshstarmer/playlists) ] --- # Método Benjamini Hochberg 1. ordenar ascendentemente y rankear valores p 2. el mayor valor p tiene el mismo valor de p ajustado 3. el siguiente es el menor entre: (i) el previo o (ii) la solución: .pull-left[ `$$p_{adjusted} = p_{value} * \left(\frac{N_{p_{value}}}{rank_{p_{value}}}\right)$$` ```r *tibble( p=seq(from = 0.01, to = 0.91, by = 0.1), r=1:10) ``` ] -- .pull-right[ ``` ## # A tibble: 10 x 2 ## p r ## <dbl> <int> ## 1 0.01 1 ## 2 0.11 2 ## 3 0.21 3 ## 4 0.31 4 ## 5 0.41 5 ## 6 0.51 6 ## 7 0.61 7 ## 8 0.71 8 ## 9 0.81 9 ## 10 0.91 10 ``` ] --- # Método Benjamini Hochberg 1. ordenar ascendentemente y rankear valores p 2. el mayor valor p tiene el mismo valor de p ajustado 3. el siguiente es el menor entre: (i) el previo o (ii) la solución: .pull-left[ `$$p_{adjusted} = p_{value} * \left(\frac{N_{p_{value}}}{rank_{p_{value}}}\right)$$` ```r tibble( p=seq(from = 0.01, to = 0.91, by = 0.1), r=1:10) %>% * mutate( * p.adjust= * p.adjust( * p = p, * method = "BH")) ``` ] .pull-right[ ``` ## # A tibble: 10 x 2 ## p r ## <dbl> <int> ## 1 0.01 1 ## 2 0.11 2 ## 3 0.21 3 ## 4 0.31 4 ## 5 0.41 5 ## 6 0.51 6 ## 7 0.61 7 ## 8 0.71 8 ## 9 0.81 9 ## 10 0.91 10 ``` ] --- # Método Benjamini Hochberg 1. ordenar ascendentemente y rankear valores p 2. el mayor valor p tiene el mismo valor de p ajustado 3. el siguiente es el menor entre: (i) el previo o (ii) la solución: .pull-left[ `$$p_{adjusted} = p_{value} * \left(\frac{N_{p_{value}}}{rank_{p_{value}}}\right)$$` ```r tibble( p=seq(from = 0.01, to = 0.91, by = 0.1), r=1:10) %>% * mutate( * p.adjust= * p.adjust( * p = p, * method = "BH")) ``` ] .pull-right[ ``` ## # A tibble: 10 x 3 ## p r p.adjust ## <dbl> <int> <dbl> ## 1 0.01 1 0.1 ## 2 0.11 2 0.55 ## 3 0.21 3 0.7 ## 4 0.31 4 0.775 ## 5 0.41 5 0.82 ## 6 0.51 6 0.85 ## 7 0.61 7 0.871 ## 8 0.71 8 0.888 ## 9 0.81 9 0.9 ## 10 0.91 10 0.91 ``` ] --- background-image: url(notrack/statquest-14.png) background-size: contain .footnote[ Stamer J. [StatQuest](https://www.youtube.com/user/joshstarmer/playlists) ] --- background-image: url(notrack/statquest-15.png) background-size: contain .footnote[ Stamer J. [StatQuest](https://www.youtube.com/user/joshstarmer/playlists) ] --- background-image: url(notrack/statquest-16.png) background-size: contain .footnote[ Stamer J. [StatQuest](https://www.youtube.com/user/joshstarmer/playlists) ] --- # Ejemplo: método BH ```r multpv %>% ggplot(aes(p.value)) + geom_histogram(binwidth=.05) + * facet_wrap(~ type, scale="free_y", nrow=2) + labs(x="P-values") ``` <!-- --> --- # Ejemplo: método BH ```r multpv %>% * group_by(type) %>% * mutate(p.adjust=p.adjust(p = p.value,method = "BH"), p.adjust_pass=if_else(p.adjust<0.05,"TRUE","FALSE")) %>% ungroup() %>% ggplot(aes(p.value,fill=p.adjust_pass)) + geom_histogram(binwidth=.05) + facet_wrap(~ type, scale="free_y", nrow=2) +labs(x="P-values",fill="BH") ``` <!-- --> --- # Aplicación: Microarray - Diseño: * Medición de la expresión en inanición (Brauer, 2008) * Cultivos de _S. cerevisiae_ expuestos a seis concentraciones de nutrientes, suministrado en seis tasas o _rates_ por un quimiostato. * Un _gene expression microarray_ mide qué tanto un gen se expresa en determinada condición. -- ```r cleaned_data <- read_rds("data-raw/microarraydata.rds") ``` .pull-left[ ```r cleaned_data %>% * count(nutrient) ``` ``` ## # A tibble: 6 x 2 ## nutrient n ## <chr> <int> ## 1 Ammonia 33141 ## 2 Glucose 33138 ## 3 Leucine 33178 ## 4 Phosphate 33068 ## 5 Sulfate 32897 ## 6 Uracil 33008 ``` ] .pull-right[ ```r cleaned_data %>% * count(rate) ``` ``` ## # A tibble: 6 x 2 ## rate n ## <dbl> <int> ## 1 0.05 32741 ## 2 0.1 33132 ## 3 0.15 33145 ## 4 0.2 33121 ## 5 0.25 33177 ## 6 0.3 33114 ``` ] --- # Microarray: visualización ```r cleaned_data %>% * filter(BP == "leucine biosynthesis") %>% plot_expression_data() #función detallada en: practica-05.R ``` <!-- --> --- # Microarray: visualización ```r cleaned_data %>% filter(BP == "cell wall organization and biogenesis") %>% plot_expression_data() ``` <!-- --> --- # Microarray: Regresión Lineal Simple ```r cleaned_data %>% #elegimos 01 gen y 01 nutriente filter(name == "LEU1", nutrient == "Leucine") %>% #graficamos la relación Y: expresión ~ X: rate ggplot(aes(rate, expression)) + #empleamos la geometría punto geom_point() ``` 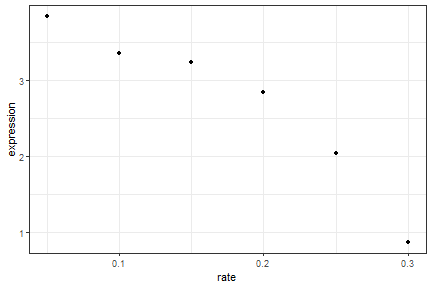<!-- --> --- # Microarray: Regresión Lineal Simple ```r cleaned_data %>% #elegimos 01 gen y 01 nutriente filter(name == "LEU1", nutrient == "Leucine") %>% #graficamos la relación Y: expresión ~ X: rate ggplot(aes(rate, expression)) + #empleamos la geometría punto geom_point() + geom_smooth(method = "lm") ``` 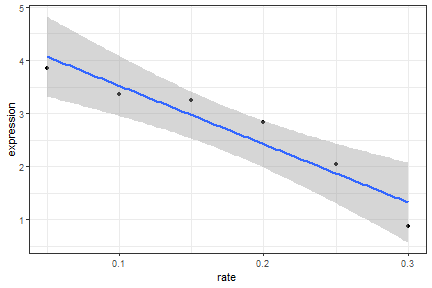<!-- --> --- # Microarray: Regresión Lineal Simple ```r cleaned_data %>% #elegimos 01 gen y 01 nutriente filter(name == "LEU1", nutrient == "Leucine") %>% #ajustamos una regresión lineal #dado que data no es el primer argumento #necesitamos especificarlo en data con "." lm(expression ~ rate, data = .) %>% #visualizamos tabla con estimados tidy() ``` ``` ## # A tibble: 2 x 5 ## term estimate std.error statistic p.value ## <chr> <dbl> <dbl> <dbl> <dbl> ## 1 (Intercept) 4.62 0.348 13.3 0.000186 ## 2 rate -11.0 1.79 -6.14 0.00356 ``` --- # Microarray: a todas los pares gen-nutriente ```r linear_models <- cleaned_data %>% * filter(nutrient=="Ammonia") %>% #filtramos por nutriente group_by(name, systematic_name, nutrient) %>% #agrupamos por gen * nest() %>% #anidamos los datos en una columna lista de df # ajustamos un modelo lineal a cada fila -ver paquete purrr::map- * mutate(model = map(data, ~ lm(expression ~ rate, data = .x)), * tidym = map(model,tidy)) ``` -- ```r linear_models ``` ``` ## # A tibble: 5,536 x 6 ## # Groups: name, systematic_name, nutrient [5,536] ## name systematic_name nutrient data model tidym ## <chr> <chr> <chr> <list> <list> <list> ## 1 "SFB2" YNL049C Ammonia <tibble [6 x 4]> <lm> <tibble [2 x 5]> ## 2 "" YNL095C Ammonia <tibble [6 x 4]> <lm> <tibble [2 x 5]> ## 3 "QRI7" YDL104C Ammonia <tibble [6 x 4]> <lm> <tibble [2 x 5]> ## 4 "CFT2" YLR115W Ammonia <tibble [6 x 4]> <lm> <tibble [2 x 5]> ## 5 "SSO2" YMR183C Ammonia <tibble [6 x 4]> <lm> <tibble [2 x 5]> ## 6 "PSP2" YML017W Ammonia <tibble [6 x 4]> <lm> <tibble [2 x 5]> ## 7 "RIB2" YOL066C Ammonia <tibble [6 x 4]> <lm> <tibble [2 x 5]> ## 8 "VMA13" YPR036W Ammonia <tibble [6 x 4]> <lm> <tibble [2 x 5]> ## 9 "EDC3" YEL015W Ammonia <tibble [6 x 4]> <lm> <tibble [2 x 5]> ## 10 "VPS5" YOR069W Ammonia <tibble [6 x 4]> <lm> <tibble [2 x 5]> ## # ... with 5,526 more rows ``` --- # Microarray: conservamos las pendientes ```r slope_terms <- linear_models %>% * unnest(cols = c(tidym)) %>% ungroup() %>% filter(term=="rate" & !is.na(p.value)) slope_terms %>% ggplot(aes(p.value)) + geom_histogram(binwidth = .01) + facet_wrap(~nutrient) ``` 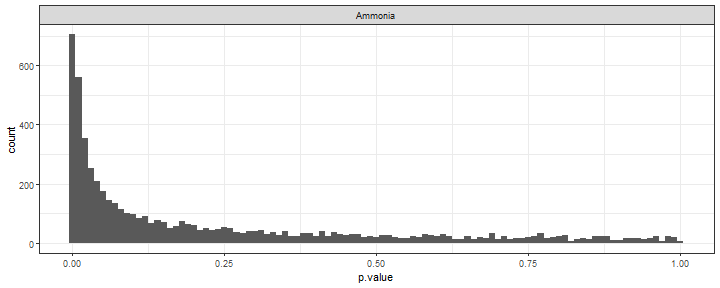<!-- --> --- # Microarray: corregimos valor p ```r slope_terms_adj <- slope_terms %>% * mutate(q.value = qvalue(p.value)$qvalues, q.value_pass=if_else(q.value < .01,"TRUE","FALSE")) slope_terms_adj %>% ggplot(aes(p.value, * fill=q.value_pass)) + geom_histogram(binwidth = .01) + facet_wrap(~nutrient) ``` 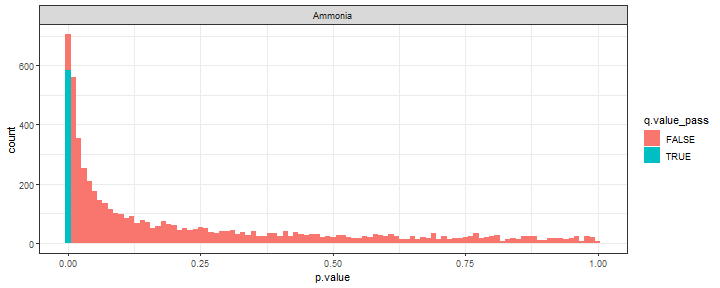<!-- --> --- # Microarray: Lista de genes de interés ```r slope_terms_adj %>% filter(q.value_pass=="TRUE") %>% * arrange(q.value) %>% select(systematic_name,nutrient,term,estimate,p.value,q.value) ``` ``` ## # A tibble: 585 x 6 ## systematic_name nutrient term estimate p.value q.value ## <chr> <chr> <chr> <dbl> <dbl> <dbl> ## 1 YBR291C Ammonia rate 11.6 0.000000582 0.000951 ## 2 YLR174W Ammonia rate -14.0 0.00000162 0.00132 ## 3 YLL003W Ammonia rate -4.22 0.00000346 0.00189 ## 4 YMR053C Ammonia rate -7.25 0.00000656 0.00268 ## 5 YEL001C Ammonia rate 6.61 0.0000155 0.00276 ## 6 YHR068W Ammonia rate 10.0 0.0000166 0.00276 ## 7 YDR069C Ammonia rate -4.49 0.00000939 0.00276 ## 8 YML128C Ammonia rate -15.0 0.0000169 0.00276 ## 9 YPR049C Ammonia rate -5.90 0.0000128 0.00276 ## 10 YGR244C Ammonia rate -5.44 0.0000135 0.00276 ## # ... with 575 more rows ``` --- # Práctica 5 - reproducir el proceso para los demás nutrientes - explorar paquete `limma` - explorar la documentación del paquete `qvalue` [link](https://github.com/StoreyLab/qvalue) ```r library(qvalue) #datos microarray qmicro <- qvalue(p = slope_terms$p.value) summary(qmicro) hist(qmicro) plot(qmicro) ``` --- # Referencias - Logan M. (2011). Biostatistical design and analysis using R: a practical guide. John Wiley & Sons. [Library Genesis](http://gen.lib.rus.ec/book/index.php?md5=9CF463AE32C405E29FCEDD99440225BE) - Akehurst H. (2016) Bioestadística con R. Curso dictado en UPCH. - Statistics for Biologist: Points of Significance. [Nature Collection](https://www.nature.com/collections/qghhqm/pointsofsignificance) - Ho J, et al. (2019). Moving beyond P values: data analysis with estimation graphics. [Nature Methods](https://www.nature.com/articles/s41592-019-0470-3.epdf?author_access_token=Euy6APITxsYA3huBKOFBvNRgN0jAjWel9jnR3ZoTv0Pr6zJiJ3AA5aH4989gOJS_dajtNr1Wt17D0fh-t4GFcvqwMYN03qb8C33na_UrCUcGrt-Z0J9aPL6TPSbOxIC-pbHWKUDo2XsUOr3hQmlRew%3D%3D) - Stamer J. StatQuest. False Discovery Rates, FDR, clearly explained. [YouTube channel](https://www.youtube.com/user/joshstarmer/playlists) - Ding J, et al. (2018). Association of gene polymorphism of SDF1(CXCR12) with susceptibility to HIV-1 infection and AIDS disease progression: A meta-analysis. [PLoS One](https://www.ncbi.nlm.nih.gov/pubmed/29420545) - Estrada-Aguirre JA, et al. (2013). Protective effect of CCR5 Delta-32 allele against HIV-1 in Mexican women. [Curr HIV Res](https://www.ncbi.nlm.nih.gov/pubmed/24382026) - Lindeløv J. (2019) Common statistical tests are linear models (or: how to teach stats) [Github personal webpage](https://lindeloev.github.io/tests-as-linear/) - Robinson D. (2014). Modeling gene expression with broom: a case study in tidy analysis. [Variance explained blog](http://varianceexplained.org/r/tidy-genomics-broom/) --- # Material complementario - Rstudio Education: [Learn](https://education.rstudio.com/learn/) * beginner, intermediate, expert tracks * transform table [here](https://rstudio-education.github.io/tidyverse-cookbook/transform-tables.html) * tidy explain *_join verbs [here](https://www.garrickadenbuie.com/project/tidyexplain/) - Rstudio [Cheat sheets](https://rstudio.com/resources/cheatsheets/) * data import * data transformation * data visualization --- class: center, middle # ¡Gracias! ## Andree Valle Campos<br/><br/> <svg viewBox="0 0 512 512" style="height:1em;position:relative;display:inline-block;top:.1em;" xmlns="http://www.w3.org/2000/svg"> <path d="M459.37 151.716c.325 4.548.325 9.097.325 13.645 0 138.72-105.583 298.558-298.558 298.558-59.452 0-114.68-17.219-161.137-47.106 8.447.974 16.568 1.299 25.34 1.299 49.055 0 94.213-16.568 130.274-44.832-46.132-.975-84.792-31.188-98.112-72.772 6.498.974 12.995 1.624 19.818 1.624 9.421 0 18.843-1.3 27.614-3.573-48.081-9.747-84.143-51.98-84.143-102.985v-1.299c13.969 7.797 30.214 12.67 47.431 13.319-28.264-18.843-46.781-51.005-46.781-87.391 0-19.492 5.197-37.36 14.294-52.954 51.655 63.675 129.3 105.258 216.365 109.807-1.624-7.797-2.599-15.918-2.599-24.04 0-57.828 46.782-104.934 104.934-104.934 30.213 0 57.502 12.67 76.67 33.137 23.715-4.548 46.456-13.32 66.599-25.34-7.798 24.366-24.366 44.833-46.132 57.827 21.117-2.273 41.584-8.122 60.426-16.243-14.292 20.791-32.161 39.308-52.628 54.253z"></path></svg> <svg viewBox="0 0 496 512" style="height:1em;position:relative;display:inline-block;top:.1em;" xmlns="http://www.w3.org/2000/svg"> <path d="M165.9 397.4c0 2-2.3 3.6-5.2 3.6-3.3.3-5.6-1.3-5.6-3.6 0-2 2.3-3.6 5.2-3.6 3-.3 5.6 1.3 5.6 3.6zm-31.1-4.5c-.7 2 1.3 4.3 4.3 4.9 2.6 1 5.6 0 6.2-2s-1.3-4.3-4.3-5.2c-2.6-.7-5.5.3-6.2 2.3zm44.2-1.7c-2.9.7-4.9 2.6-4.6 4.9.3 2 2.9 3.3 5.9 2.6 2.9-.7 4.9-2.6 4.6-4.6-.3-1.9-3-3.2-5.9-2.9zM244.8 8C106.1 8 0 113.3 0 252c0 110.9 69.8 205.8 169.5 239.2 12.8 2.3 17.3-5.6 17.3-12.1 0-6.2-.3-40.4-.3-61.4 0 0-70 15-84.7-29.8 0 0-11.4-29.1-27.8-36.6 0 0-22.9-15.7 1.6-15.4 0 0 24.9 2 38.6 25.8 21.9 38.6 58.6 27.5 72.9 20.9 2.3-16 8.8-27.1 16-33.7-55.9-6.2-112.3-14.3-112.3-110.5 0-27.5 7.6-41.3 23.6-58.9-2.6-6.5-11.1-33.3 2.6-67.9 20.9-6.5 69 27 69 27 20-5.6 41.5-8.5 62.8-8.5s42.8 2.9 62.8 8.5c0 0 48.1-33.6 69-27 13.7 34.7 5.2 61.4 2.6 67.9 16 17.7 25.8 31.5 25.8 58.9 0 96.5-58.9 104.2-114.8 110.5 9.2 7.9 17 22.9 17 46.4 0 33.7-.3 75.4-.3 83.6 0 6.5 4.6 14.4 17.3 12.1C428.2 457.8 496 362.9 496 252 496 113.3 383.5 8 244.8 8zM97.2 352.9c-1.3 1-1 3.3.7 5.2 1.6 1.6 3.9 2.3 5.2 1 1.3-1 1-3.3-.7-5.2-1.6-1.6-3.9-2.3-5.2-1zm-10.8-8.1c-.7 1.3.3 2.9 2.3 3.9 1.6 1 3.6.7 4.3-.7.7-1.3-.3-2.9-2.3-3.9-2-.6-3.6-.3-4.3.7zm32.4 35.6c-1.6 1.3-1 4.3 1.3 6.2 2.3 2.3 5.2 2.6 6.5 1 1.3-1.3.7-4.3-1.3-6.2-2.2-2.3-5.2-2.6-6.5-1zm-11.4-14.7c-1.6 1-1.6 3.6 0 5.9 1.6 2.3 4.3 3.3 5.6 2.3 1.6-1.3 1.6-3.9 0-6.2-1.4-2.3-4-3.3-5.6-2z"></path></svg> __`@avallecam`__ <br/><br/> <svg viewBox="0 0 576 512" style="height:1em;position:relative;display:inline-block;top:.1em;" xmlns="http://www.w3.org/2000/svg"> <path d="M567.938 243.908L462.25 85.374A48.003 48.003 0 0 0 422.311 64H153.689a48 48 0 0 0-39.938 21.374L8.062 243.908A47.994 47.994 0 0 0 0 270.533V400c0 26.51 21.49 48 48 48h480c26.51 0 48-21.49 48-48V270.533a47.994 47.994 0 0 0-8.062-26.625zM162.252 128h251.497l85.333 128H376l-32 64H232l-32-64H76.918l85.334-128z"></path></svg> __avallecam@gmail.com__ .footnote[ Slides created via the R package [**xaringan**](https://github.com/yihui/xaringan). ] --- class: center, middle background-image: url(https://upload.wikimedia.org/wikipedia/commons/3/39/Naruto_Shiki_Fujin.svg) background-size: contain