Introduction: serosurvey R package
intro.RmdIntroduction
Here we present three examples, definitions and related references:
1. survey: Estimate single prevalences
-
From a
srvyrsurvey design object,serosvy_proportionestimates:- weighted prevalence (
prop), - total population (
total), - raw proportion (
raw_prop), - coefficient of variability (
cv), - design effect (
deff)
- weighted prevalence (
serosvy_proportion(design = design,
                   denominator = covariate_01,
                   numerator = outcome_one)
#> # A tibble: 6 x 23
#>   denominator denominator_lev~ numerator numerator_level  prop prop_low
#>   <chr>       <fct>            <chr>     <fct>           <dbl>    <dbl>
#> 1 covariate_~ E                outcome_~ No              0.211   0.130
#> 2 covariate_~ E                outcome_~ Yes             0.789   0.675
#> 3 covariate_~ H                outcome_~ No              0.852   0.564
#> 4 covariate_~ H                outcome_~ Yes             0.148   0.0377
#> 5 covariate_~ M                outcome_~ No              0.552   0.224
#> 6 covariate_~ M                outcome_~ Yes             0.448   0.160
#> # ... with 17 more variables: prop_upp <dbl>, prop_cv <dbl>,
#> #   prop_se <dbl>, total <dbl>, total_low <dbl>, total_upp <dbl>,
#> #   total_cv <dbl>, total_se <dbl>, total_deff <dbl>, total_den <dbl>,
#> #   total_den_low <dbl>, total_den_upp <dbl>, raw_num <int>,
#> #   raw_den <int>, raw_prop <dbl>, raw_prop_low <dbl>, raw_prop_upp <dbl>
2. survey: Estimate multiple prevalences
-
In the Article tab we provide a workflow to estimate multiple prevalences:
- using different set of covariates and outcomes as numerators or denominators,
- in one single pipe operation
# crear matriz
  #
  # set 01 of denominator-numerator
  #
expand_grid(
  design=list(design),
  denominator=c("covariate_01","covariate_02"), # covariates
  numerator=c("outcome_one","outcome_two") # outcomes
  ) %>%
  #
  # set 02 of denominator-numerator (e.g. within main outcome)
  #
  union_all(
    expand_grid(
      design=list(design),
      denominator=c("outcome_one","outcome_two"), # outcomes
      numerator=c("covariate_02") # covariates
    )
  ) %>%
  #
  # create symbols (to be readed as arguments)
  #
  mutate(
    denominator=map(denominator,dplyr::sym),
    numerator=map(numerator,dplyr::sym)
  ) %>%
  #
  # estimate prevalence
  #
  mutate(output=pmap(.l = select(.,design,denominator,numerator),
                     .f = serosvy_proportion)) %>%
  #
  # show the outcome
  #
  select(-design,-denominator,-numerator) %>%
  unnest(cols = c(output)) %>%
  print(n=Inf)
#> # A tibble: 25 x 23
#>    denominator denominator_lev~ numerator numerator_level   prop prop_low
#>    <chr>       <fct>            <chr>     <fct>            <dbl>    <dbl>
#>  1 covariate_~ E                outcome_~ No              0.211   0.130
#>  2 covariate_~ E                outcome_~ Yes             0.789   0.675
#>  3 covariate_~ H                outcome_~ No              0.852   0.564
#>  4 covariate_~ H                outcome_~ Yes             0.148   0.0377
#>  5 covariate_~ M                outcome_~ No              0.552   0.224
#>  6 covariate_~ M                outcome_~ Yes             0.448   0.160
#>  7 covariate_~ E                outcome_~ (-0.1,50]       0.182   0.0499
#>  8 covariate_~ E                outcome_~ (50,100]        0.818   0.515
#>  9 covariate_~ H                outcome_~ (-0.1,50]       0.0769  0.00876
#> 10 covariate_~ H                outcome_~ (50,100]        0.923   0.560
#> 11 covariate_~ M                outcome_~ (50,100]        1.00    1.00
#> 12 covariate_~ No               outcome_~ No              1.00    1.00
#> 13 covariate_~ Yes              outcome_~ No              0.0334  0.00884
#> 14 covariate_~ Yes              outcome_~ Yes             0.967   0.882
#> 15 covariate_~ No               outcome_~ (-0.1,50]       0.218   0.0670
#> 16 covariate_~ No               outcome_~ (50,100]        0.782   0.479
#> 17 covariate_~ Yes              outcome_~ (-0.1,50]       0.0914  0.0214
#> 18 covariate_~ Yes              outcome_~ (50,100]        0.909   0.684
#> 19 outcome_one No               covariat~ No              0.939   0.778
#> 20 outcome_one No               covariat~ Yes             0.0615  0.0148
#> 21 outcome_one Yes              covariat~ Yes             1.00    1.00
#> 22 outcome_two (-0.1,50]        covariat~ No              0.549   0.294
#> 23 outcome_two (-0.1,50]        covariat~ Yes             0.451   0.219
#> 24 outcome_two (50,100]         covariat~ No              0.305   0.188
#> 25 outcome_two (50,100]         covariat~ Yes             0.695   0.546
#> # ... with 17 more variables: prop_upp <dbl>, prop_cv <dbl>,
#> #   prop_se <dbl>, total <dbl>, total_low <dbl>, total_upp <dbl>,
#> #   total_cv <dbl>, total_se <dbl>, total_deff <dbl>, total_den <dbl>,
#> #   total_den_low <dbl>, total_den_upp <dbl>, raw_num <int>,
#> #   raw_den <int>, raw_prop <dbl>, raw_prop_low <dbl>, raw_prop_upp <dbl>
3. serology: Estimate prevalence Under misclassification
We gather one frequentist approach (Rogan and Gladen 1978), available in different Github repos, that deal with misclassification due to an imperfect diagnostic test (Azman et al. 2020; Takahashi, Greenhouse, and Rodríguez-Barraquer 2020). Check the Reference tab.
We provide tidy outputs for bayesian approaches developed in Daniel B. Larremore et al. (2020) here and Daniel B Larremore et al. (2020) here:
You can use them with
purrrandfurrrto efficiently iterate and parallelize this step for multiple prevalences. Check the workflow in Article tab.
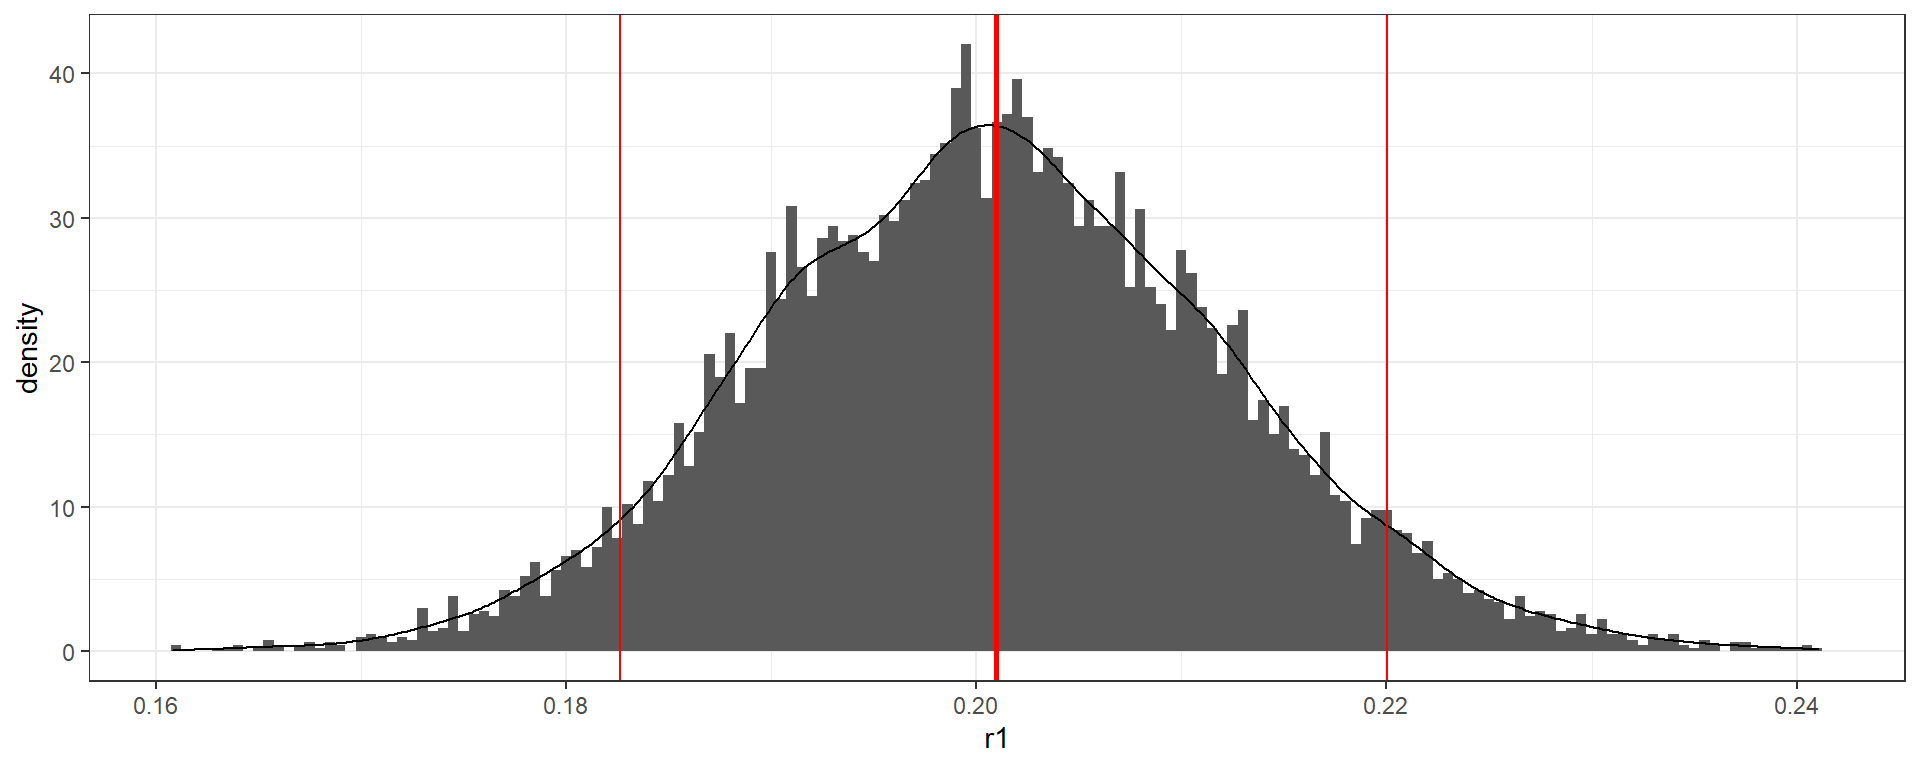
Known test performance - Bayesian method
serosvy_known_sample_posterior(
  #in population
  positive_number_test = 321,
  total_number_test = 321+1234,
  # known performance
  sensitivity = 0.93,
  specificity = 0.975
)
Unknown test performance - Bayesian method
- The test performance is called “unknown” or “uncertain” when test sensitivity and specificity are not known with certainty (Kritsotakis 2020; Diggle 2011; Gelman and Carpenter 2020) and lab validation data is available with a limited set of samples, tipically during a novel pathogen outbreak.
serosvy_unknown_sample_posterior_ii(
  #in population
  positive_number_test = 321,
  total_number_test = 321+1234,
  # in lab (local validation study)
  true_positive = 670,
  true_negative = 640,
  false_positive = 202,
  false_negative = 74)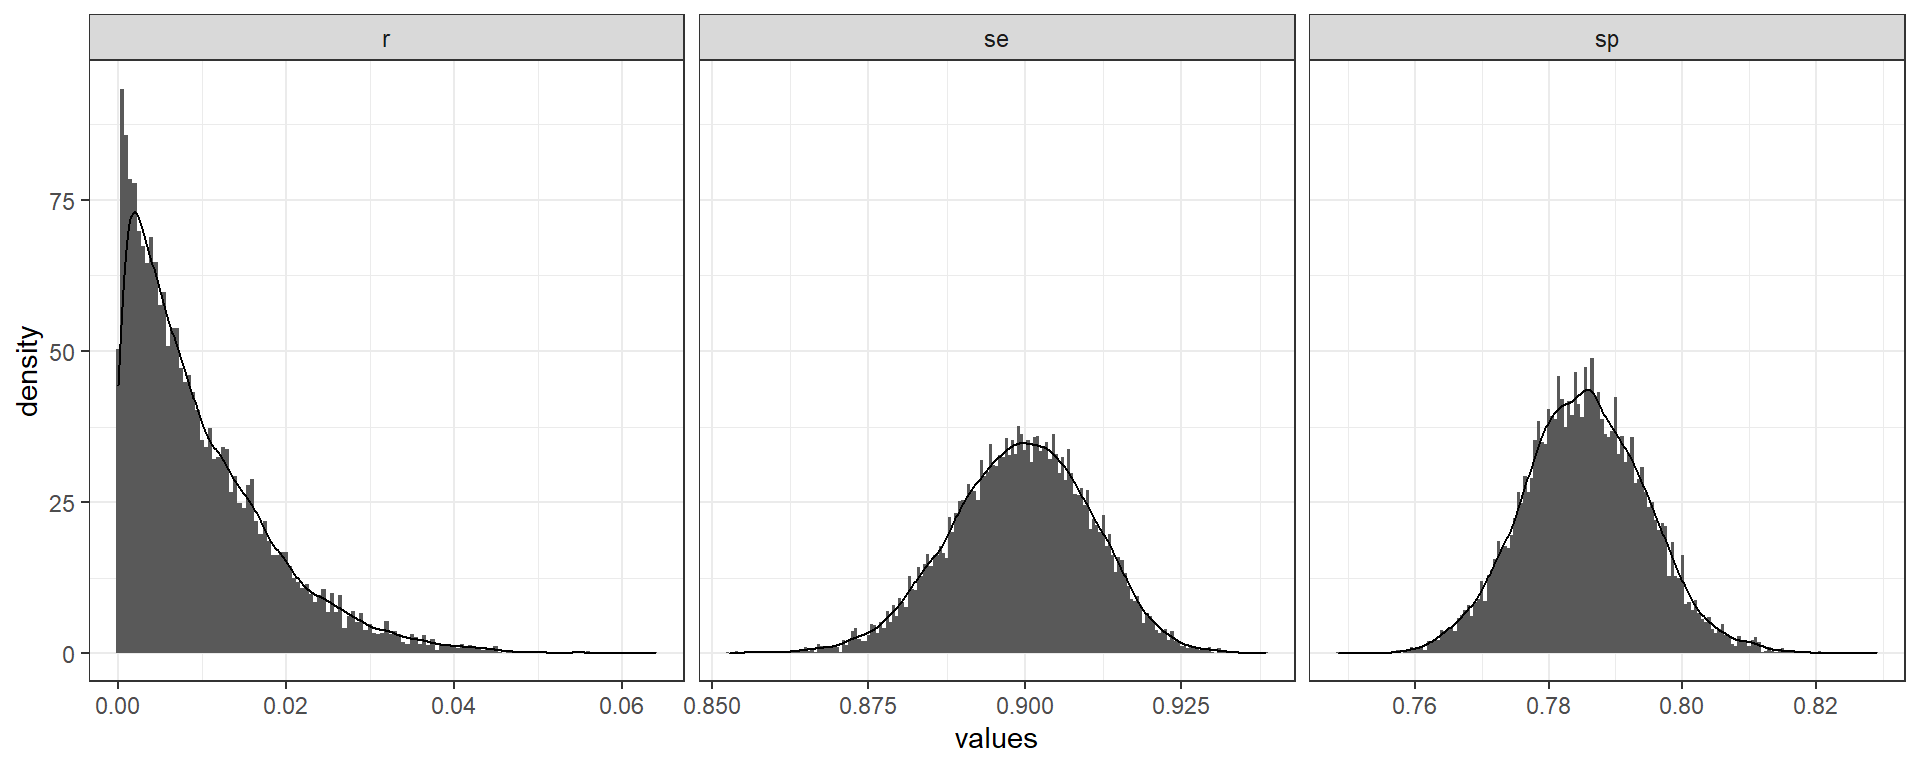
Contributing
Feel free to fill an issue or contribute with your functions or workflows in a pull request.
Here are a list of publications with interesting approaches using R:
Silveira et al. (2020) and Hallal et al. (2020) analysed a serological survey accounting for sampling design and test validity using parametric bootstraping, following Lewis and Torgerson (2012).
Flor et al. (2020) implemented a lot of frequentist and bayesian methods for test with known sensitivity and specificity. Code is available here.
Gelman and Carpenter (2020) also applied Bayesian inference with hierarchical regression and post-stratification to account for test uncertainty with unknown specificity and sensitivity. Here a case-study.
References
Azman, Andrew S, Stephen Lauer, M. Taufiqur Rahman Bhuiyan, Francisco J Luquero, Daniel T Leung, Sonia Hegde, Jason B Harris, et al. 2020. “Vibrio Cholerae O1 Transmission in Bangladesh: Insights from a Nationally- Representative Serosurvey,” March. https://doi.org/10.1101/2020.03.13.20035352.
Diggle, Peter J. 2011. “Estimating Prevalence Using an Imperfect Test.” Epidemiology Research International 2011: 1–5. https://doi.org/10.1155/2011/608719.
Flor, Matthias, Michael Weiß, Thomas Selhorst, Christine Müller-Graf, and Matthias Greiner. 2020. “Comparison of Bayesian and Frequentist Methods for Prevalence Estimation Under Misclassification.” BMC Public Health 20 (1). https://doi.org/10.1186/s12889-020-09177-4.
Gelman, Andrew, and Bob Carpenter. 2020. “Bayesian Analysis of Tests with Unknown Specificity and Sensitivity.” Journal of the Royal Statistical Society: Series C (Applied Statistics), August. https://doi.org/10.1111/rssc.12435.
Hallal, Pedro C, Fernando P Hartwig, Bernardo L Horta, Mariângela F Silveira, Claudio J Struchiner, Luı́s P Vidaletti, Nelson A Neumann, et al. 2020. “SARS-CoV-2 Antibody Prevalence in Brazil: Results from Two Successive Nationwide Serological Household Surveys.” The Lancet Global Health, September. https://doi.org/10.1016/s2214-109x(20)30387-9.
Kritsotakis, Evangelos I. 2020. “On the Importance of Population-Based Serological Surveys of SARS-CoV-2 Without Overlooking Their Inherent Uncertainties.” Public Health in Practice 1 (November): 100013. https://doi.org/10.1016/j.puhip.2020.100013.
Larremore, Daniel B, Bailey K Fosdick, Kate M Bubar, Sam Zhang, Stephen M Kissler, C. Jessica E. Metcalf, Caroline Buckee, and Yonatan Grad. 2020. “Estimating SARS-CoV-2 Seroprevalence and Epidemiological Parameters with Uncertainty from Serological Surveys.” medRxiv, April. https://doi.org/10.1101/2020.04.15.20067066.
Larremore, Daniel B., Bailey K. Fosdick, Sam Zhang, and Yonatan H. Grad. 2020. “Jointly Modeling Prevalence, Sensitivity and Specificity for Optimal Sample Allocation.” bioRxiv, May. https://doi.org/10.1101/2020.05.23.112649.
Lewis, Fraser I, and Paul R Torgerson. 2012. “A Tutorial in Estimating the Prevalence of Disease in Humans and Animals in the Absence of a Gold Standard Diagnostic.” Emerging Themes in Epidemiology 9 (1). https://doi.org/10.1186/1742-7622-9-9.
Rogan, Walter J., and Beth Gladen. 1978. “Estimating Prevalence from the Results of A Screening Test.” American Journal of Epidemiology 107 (1): 71–76. https://doi.org/10.1093/oxfordjournals.aje.a112510.
Silveira, Mariângela F., Aluı́sio J. D. Barros, Bernardo L. Horta, Lúcia C. Pellanda, Gabriel D. Victora, Odir A. Dellagostin, Claudio J. Struchiner, et al. 2020. “Population-Based Surveys of Antibodies Against SARS-CoV-2 in Southern Brazil.” Nature Medicine 26 (8): 1196–9. https://doi.org/10.1038/s41591-020-0992-3.
Takahashi, Saki, Bryan Greenhouse, and Isabel Rodríguez-Barraquer. 2020. “Are SARS-CoV-2 seroprevalence estimates biased?” The Journal of Infectious Diseases, August. https://doi.org/10.1093/infdis/jiaa523.